

The CVE Tracker has been shared as a chart that shows, at a glance, how AI made vulnerability discovery explode. The right edge of the chart does rise almost vertically. But the chart only shows the total. It does not show where the increase happened, or in which languages.
So we recounted the data behind it, the records published by the CVE Project in cvelistV5. The numbers in this article are from that recount, and the totals match the chart to within 2%.
A CVE is a shared identifier for a published vulnerability. The CVE Tracker plots how many were published per month or per day. In 2026, January had 4,302 and October had 17,049. October 2025 had 4,274, so that is about four times as many. All of 2025 had 48,151. From January to October 2026 there were 89,849, about 2.3 times the same period last year (39,638), and already more than the whole of 2025.
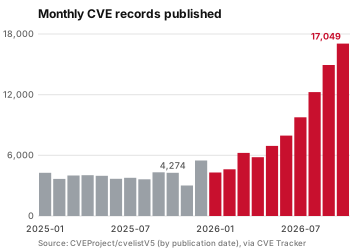
In 2025, every month stayed between 3,000 and 5,500. The change started in March 2026, with 6,236. It reached 9,759 in July, 12,258 in August and 14,934 in September, rising by more than 2,000 each month. In June, FIRST raised its 2026 forecast to 66,000 (@IT, in Japanese). Adding up the months, the total passed that forecast in September, at 72,800.
Many reports explain this as “AI is digging up vulnerabilities,” and the CVE Tracker can overlay AI model release dates. FIRST also names AI as one factor, citing Mozilla’s AI-assisted testing that led to 271 fixes in Firefox 150 (@IT, in Japanese). But CVE records carry no mark for AI discovery, so the effect of AI cannot be pulled out of the counts.
CVE numbers are assigned by CVE Numbering Authorities (CNAs). Comparing January to October 2026 with the same period of 2025 by CNA shows that the increase is not even.
A handful of organizations account for most of it. GitHub went from 2,256 to 12,443, VulnCheck from 336 to 7,678, the Linux kernel from 4,476 to 8,201, Microsoft from 1,108 to 4,437, Oracle from 314 to 4,154, and Chrome (Google) from 110 to 3,667. These six alone account for 65% of the increase. All the other organizations together grew about 1.6 times.
Meanwhile Patchstack, which covers many WordPress plugin vulnerabilities, went down from 5,922 to 5,143. VulDB went from 5,145 to 6,106, or 1.2 times.
So the overall rise depends heavily on how a few large organizations assign numbers. Chrome’s jump from 110 to 3,667 is 33 times. It is hard to believe the software got 33 times worse in a year; the scope or policy of numbering probably changed. For VulnCheck, FIRST says its numbering of previously unregistered vulnerabilities grew by 3,119 over the previous year (@IT, in Japanese). It is natural to see two things mixed together: increases from AI finding flaws, and increases from numbering things that used to go without a number.
CVE records have no field for the language of the software. As a substitute, we compared the reviewed entries in the GitHub Advisory Database, which are organized by package registry (npm, PyPI and so on). Registries map closely to languages, so they work as a rough guide.
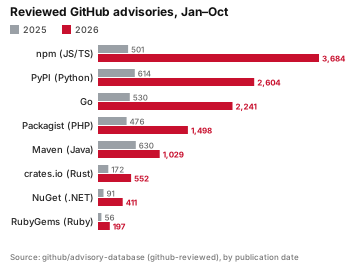
In total, entries went from 3,104 to 12,338, about four times. The largest rise was npm (JavaScript and TypeScript), from 501 to 3,684, or 7.4 times. PyPI (Python) went from 614 to 2,604 and Go from 530 to 2,241, both 4.2 times. NuGet (.NET) rose 4.5 times, RubyGems 3.5 times, crates.io (Rust) 3.2 times and Packagist (PHP) 3.1 times. The smallest rise was Maven (Java), at 1.6 times.
Reading this as “JavaScript is the most dangerous” would be premature. npm simply has far more packages to begin with, so it produces more findings. And the package-side count reached 1,649 in March, stayed between 1,400 and 1,700 through July, then fell to 869, 970 and 1,224 from August. The overall chart keeps climbing through October, so what drives the total is outside the registries: operating systems, browsers, databases and other large products.
C and C++ are not in package registries, so they are missing from the numbers above. Instead, we counted the kinds of weakness that tend to occur in those languages: memory handling errors such as use-after-free and out-of-bounds reads and writes. There were 3,344 such records from January to October 2025 and 10,450 in 2026, about 3.1 times. Microsoft and Chrome (Google) account for about 40% of them.
By weakness type (CWE), the growth is lopsided. XSS (injecting scripts into web pages) and SQL injection went from 8,994 to 10,074, only 1.1 times, and their share of all records fell from 23% to 11%.
What is growing is permission and authentication flaws. Improper authorization (CWE-863) went from 305 to 2,054, flaws that expose other users’ data (CWE-639) from 242 to 1,867, and server-side request forgery (CWE-918) from 390 to 1,992. Authorization and authentication weaknesses together went from 3,595 to 11,860, 3.3 times, and GitHub and VulnCheck numbers account for about 40% of them. Path handling flaws (CWE-22) rose 3.5 times and OS command injection (CWE-78) 3.4 times. CSRF (CWE-352), on the other hand, fell from 1,500 to 887.
This is only our reading, but flaws that tools find mechanically, the template kind, did not grow much, while flaws you can only find by understanding what the code means did. That overlaps with what AI reading code is good at. These numbers alone cannot prove that AI is the cause. About 25% of records have no CWE at all.
Twice as many CVEs does not mean twice the danger. FIRST says the vulnerabilities that need urgent patching, those on CISA’s exploited list or with an EPSS score above 10%, have not grown much, and that the challenge is shifting from finding flaws to choosing which to fix (@IT, in Japanese).
A restaurant or a small company does not need to follow every new number. What matters is whether the things you actually use are on the list.
Start with an inventory: the WordPress site and its plugins, the e-commerce platform, the router and VPN at the office, and the npm and Python components your website uses. Then decide the order of fixes not by how many CVEs there are, but by whether something is actually being exploited. For edge devices, see our article on VPNs and email gateways. For checking components, see the Brotli article. For what leaders should decide first, see the zero trust article.
If you want help taking an inventory of what your site and systems use and setting up an update routine, please contact us.
We are currently taking free consultations on security. Questions like "Is our site safe?" or "Where should we start checking?" are welcome.
 Chargebacks at New York Restaurants: What to Do Before They Happen, for To-Go Orders and Dine-In Checks11/2/2026
 Earning Cybersecurity Certifications in the US, Stage by Stage: Exams, Exam Fees and Study Costs (October 2026)10/30/2026
 An Adobe Commerce and Magento Flaw Joins CISA's Exploited List: Fixed in July, Attacked Since March, and What to Check10/30/2026
 15 Jenkins Core Flaws: Only One Works Without Login, but Some Need Nothing More Than Read Access10/30/2026
 A Severity 9.8 Linux Kernel Flaw: What the AI-Built Attack Needs, and Where Each Distribution Stands10/30/2026
 Two Critical GitLab Flaws, Not One: Why the October 12 Fix Is Not Enough10/30/2026

43 W 33rd St, #202, New York, NY 10001
Phone: +1 (848) 281-7853
Email: info@supersonicdesign.com


